
What is Google Analytics? #
Google Analytics is a web analytics service offered by Google that tracks and reports website traffic. It provides insights into how users interact with a website, such as the number of visits, average time on site, and the pages visited. This information can be used to optimize a website and improve the user experience. Google Analytics uses cookies and tracking codes to collect data and provide detailed reports and graphs that can be used to measure website performance and make informed decisions about online marketing and website design. It is widely used by businesses, digital marketers, and website owners to gain valuable insights into their online audience and optimize their online presence.
What is GA4? #
Google Analytics 4 is the latest version of Google’s web analytics platform that provides insights into user behavior on websites and apps
Google Analytics 4 offers several benefits compared to previous versions of the platform, including:
- Cross-device tracking: This allows you to track users across multiple devices and channels, providing a more complete view of their behavior.
- Machine learning: Google Analytics 4 uses machine learning to provide insights and automate data analysis, making it easier for you to understand your data.
- Improved integration: It integrates with other Google products such as Google Ads, Google Tag Manager, and Google BigQuery, providing a more streamlined and efficient workflow.
- User engagement measurement: The platform provides enhanced measurement of user engagement, such as scroll depth, video engagement, and outbound link clicks.
- Customizable reporting: Google Analytics 4 provides customizable reports and dashboards to help you understand your data and make informed decisions.
- Event tracking: This allows you to track user interactions with specific elements on a website or app, such as button clicks, form submissions, and page views.
- Audience Insights: The Audience Insights feature provides insights into user demographics, interests, and behavior patterns.
- Conversions: The Conversions feature allows you to track and analyze conversions, such as form submissions, purchases, and sign-ups.
- Universal App tracking: Google Analytics 4 includes the ability to track and analyze user behavior in both websites and apps using a single property.
Avetti Commerce uses Google Analytics so you can gain a deeper understanding of your users and make informed decisions to improve your website or app and drive business growth.
Dashboard Reports #
Avetti Commerce is also working on providing reports using the Google Analytics GA4 Data – Dimensions and Metrics API.
Some reports that will be available directly on the Dashboard are:
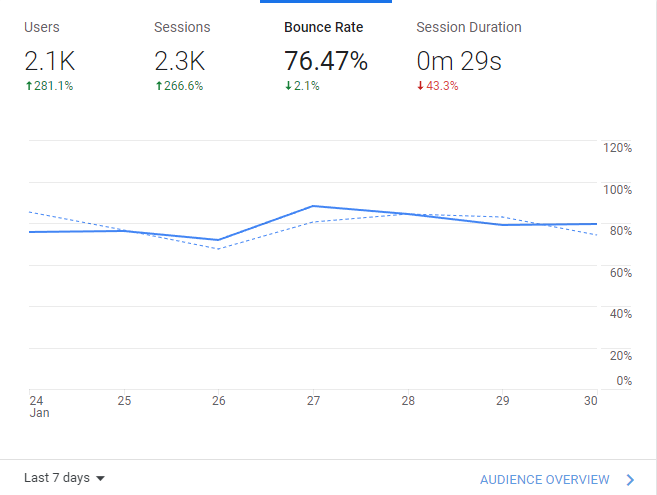
Bounce Rate #
The percentage of sessions that were not engaged ((Sessions Minus Engaged sessions) divided by Sessions). This metric is returned as a fraction; for example, 0.2761 means 27.61% of sessions were bounced.
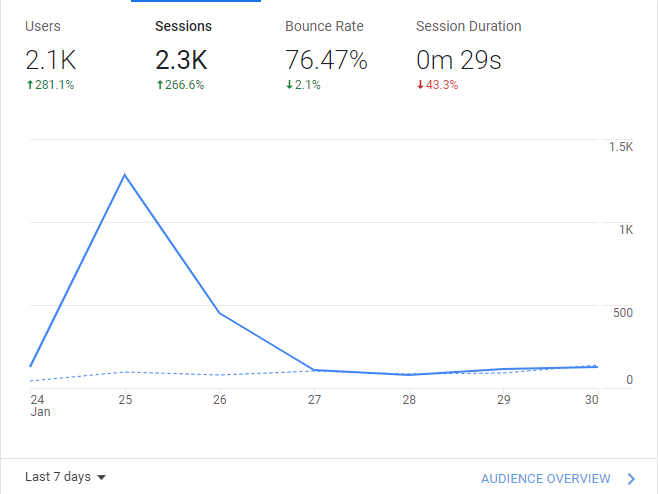
Sessions #
The number of sessions that lasted longer than 10 seconds, or had a conversion event, or had 2 or more screen views.
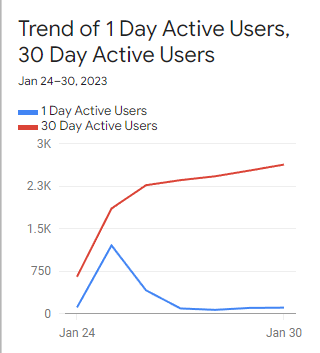
DAU / MAU #
The rolling percent of 30-day active users who are also 1-day active users. This metric is returned as a fraction; for example, 0.113 means 11.3% of 30-day active users were also 1-day active users.
Add To Carts #
The number of times users added items to their shopping carts.
Metrics #
| API Name | UI Name | Description |
|---|---|---|
| active1DayUsers | 1-day active users | The number of distinct active users on your site or app within a 1 day period. The 1 day period includes the last day in the report’s date range. Note: this is the same as Active Users. |
| active28DayUsers | 28-day active users | The number of distinct active users on your site or app within a 28 day period. The 28 day period includes the last day in the report’s date range. |
| active7DayUsers | 7-day active users | The number of distinct active users on your site or app within a 7 day period. The 7 day period includes the last day in the report’s date range. |
| activeUsers | Active users | The number of distinct users who visited your site or app. |
| adUnitExposure | Ad unit exposure | The time that an ad unit was exposed to a user, in milliseconds. |
| addToCarts | Add to carts | The number of times users added items to their shopping carts. |
| advertiserAdClicks | Ads clicks | Total number of times users have clicked on an ad to reach the property. Includes clicks from linked integrations like linked Search Ads 360 advertisers. Also includes uploaded clicks from data import. |
| advertiserAdCost | Ads cost | The total amount you paid for your ads. Includes costs from linked integrations like linked Google Ads accounts. Also includes uploaded cost from data import; to learn more, see Import cost data. |
| advertiserAdCostPerClick | Ads cost per click | Ads cost per click is ad cost divided by ad clicks and is often abbreviated CPC. |
| advertiserAdCostPerConversion | Cost per conversion | Cost per conversion is ad cost divided by conversions. |
| advertiserAdImpressions | Ads impressions | The total number of impressions. Includes impressions from linked integrations like linked Display & Video 360 advertisers. Also includes uploaded impressions from data import. |
| averagePurchaseRevenue | Average purchase revenue | The average purchase revenue in the transaction group of events. |
| averagePurchaseRevenuePerPayingUser | ARPPU | Average revenue per paying user (ARPPU) is the total purchase revenue per active user that logged a purchase event. The summary metric is for the time period selected. |
| averagePurchaseRevenuePerUser | Average purchase revenue per user | The average purchase revenue per active user is the total purchase revenue per active user that logged any event. The summary metric is for the time period selected. |
| averageRevenuePerUser | ARPU | Average revenue per active user (ARPU). The summary metric is for the time period selected. ARPU uses Total Revenue and includes AdMob estimated earnings. |
| averageSessionDuration | Average session duration | The average duration (in seconds) of users’ sessions. |
| bounceRate | Bounce rate | The percentage of sessions that were not engaged ((Sessions Minus Engaged sessions) divided by Sessions). This metric is returned as a fraction; for example, 0.2761 means 27.61% of sessions were bounces. |
| cartToViewRate | Cart-to-view rate | The number of users who added a product(s) to their cart divided by the number of users who viewed the same product(s). This metric is returned as a fraction; for example, 0.1132 means 11.32% of users who viewed a product also added the same product to their cart. |
| checkouts | Checkouts | The number of times users started the checkout process. This metric counts the occurrence of the ‘begin_checkout’ event. |
| cohortActiveUsers | Cohort active users | The number of users in the cohort who are active in the time window corresponding to the cohort nth day/week/month. For example for the row where cohortNthWeek = 0001, this metric is the number of users (in the cohort) who are active in week 1. |
| cohortTotalUsers | Cohort total users | The total number of users in the cohort. This metric is the same value in every row of the report for each cohort. Because cohorts are defined by a shared acquisition date, cohortTotalUsers is the same as cohortActiveUsers for the cohort’s selection date range. For report rows later than the ochort’s selection range, it is typical for cohortActiveUsers to be smaller than cohortTotalUsers. This difference represents users from the cohort that were not active for the later date. cohortTotalUsers is commonly used in the metric expression cohortActiveUsers/cohortTotalUsers to compute a user retention fraction for the cohort. The relationship between activeUsers and totalUsers is not equivalent to the relationship between cohortActiveUsers and cohortTotalUsers. |
| conversions | Conversions | The count of conversion events. Events are marked as conversions at collection time; changes to an event’s conversion marking apply going forward. You can mark any event as a conversion in Google Analytics, and some events (i.e. first_open, purchase) are marked as conversions by default. To learn more, see https://support.google.com/analytics/answer/9267568. |
| crashAffectedUsers | Crash-affected users | The number of users that logged a crash in this row of the report. For example if the report is time series by date, this metrics reports total users with at least one crash on this date. Crashes are events with the name “app_exception”. |
| crashFreeUsersRate | Crash-free users rate | The number of users without crash events (in this row of the report) divided by the total number of users. This metric is returned as a fraction; for example, 0.9243 means 92.43% of users were crash-free. |
| dauPerMau | DAU / MAU | The rolling percent of 30-day active users who are also 1-day active users. This metric is returned as a fraction; for example, 0.113 means 11.3% of 30-day active users were also 1-day active users. |
| dauPerWau | DAU / WAU | The rolling percent of 7-day active users who are also 1-day active users. This metric is returned as a fraction; for example, 0.082 means 8.2% of 7-day active users were also 1-day active users. |
| ecommercePurchases | Ecommerce purchases | The number of times users completed a purchase. This metric counts ‘purchase’ events; this metric does not count ‘in_app_purchase’ and subscription events. |
| engagedSessions | Engaged sessions | The number of sessions that lasted longer than 10 seconds, or had a conversion event, or had 2 or more screen views. |
| engagementRate | Engagement rate | The percentage of engaged sessions (Engaged sessions divided by Sessions). This metric is returned as a fraction; for example, 0.7239 means 72.39% of sessions were engaged sessions. |
| eventCount | Event count | The count of events. |
| eventCountPerUser | Event count per user | The average number of events per user (Event count divided by Active users). |
| eventValue | Event value | The sum of the event parameter named ‘value’. |
| eventsPerSession | Events per session | The average number of events per session (Event count divided by Sessions). |
| firstTimePurchaserConversionRate | First-time purchaser conversion | The percentage of active users who made their first purchase. This metric is returned as a fraction; for example, 0.092 means 9.2% of active users were first time purchasers. |
| firstTimePurchasers | First time purchasers | The number of users that completed their first purchase event. |
| firstTimePurchasersPerNewUser | First-time purchasers per new user | The average number of first time purchasers per new user. |
| itemListClickEvents | Item-list click events | The number of times users clicked an item when it appeared in a list. This metric counts the occurrence of the ‘select_item’ event. |
| itemListClickThroughRate | Item list click through rate | The number of users who selected a list(s) divided by the number of users who viewed the same list(s). This metric is returned as a fraction; for example, 0.2145 means 21.45% of users who viewed a list also selected the same list. |
| itemListViewEvents | Item-list view events | The number of times the item list was viewed. This metric counts the occurrence of the ‘view_item_list’ event. |
| itemPromotionClickThroughRate | Item promotion click through rate | The number of users who selected a promotion(s) divided by the number of users who viewed the same promotion(s). This metric is returned as a fraction; for example, 0.1382 means 13.82% of users who viewed a promotion also selected the promotion. |
| itemRevenue | Item revenue | The total revenue from items only. Item revenue is the product of its price and quantity. Item revenue excludes tax and shipping values; tax & shipping values are specified at the event and not item level. |
| itemViewEvents | Item view events | The number of times the item details were viewed. The metric counts the occurrence of the ‘view_item’ event. |
| itemsAddedToCart | Items added to cart | The number of units added to cart for a single item. This metric counts the quantity of items in ‘add_to_cart’ events. |
| itemsCheckedOut | Items checked out | The number of units checked out for a single item. This metric counts the quantity of items in ‘begin_checkout’ events. |
| itemsClickedInList | Items clicked in list | The number of units clicked in list for a single item. This metric counts the quantity of items in ‘select_item’ events. |
| itemsClickedInPromotion | Items clicked in promotion | The number of units clicked in promotion for a single item. This metric counts the quantity of items in ‘select_promotion’ events. |
| itemsPurchased | Items purchased | The number of units for a single item included in purchase events. This metric counts the quantity of items in purchase events. |
| itemsViewed | Items viewed | The number of units viewed for a single item. This metric counts the quantity of items in ‘view_item’ events. |
| itemsViewedInList | Items viewed in list | The number of units viewed in list for a single item. This metric counts the quantity of items in ‘view_item_list’ events. |
| itemsViewedInPromotion | Items viewed in promotion | The number of units viewed in promotion for a single item. This metric counts the quantity of items in ‘view_promotion’ events. |
| newUsers | New users | The number of users who interacted with your site or launched your app for the first time (event triggered: first_open or first_visit). |
| organicGoogleSearchAveragePosition | Organic google search average position | The average ranking of your website URLs for the query reported from Search Console. For example, if your site’s URL appears at position 3 for one query and position 7 for another query, the average position would be 5 (3+7/2). This metric requires an active Search Console link. |
| organicGoogleSearchClickThroughRate | Organic google search click through rate | The organic Google Search click through rate reported from Search Console. Click through rate is clicks per impression. This metric is returned as a fraction; for example, 0.0588 means about 5.88% of impressions resulted in a click. This metric requires an active Search Console link. |
| organicGoogleSearchClicks | Organic google search clicks | The number of organic Google Search clicks reported from Search Console. This metric requires an active Search Console link. |
| organicGoogleSearchImpressions | Organic google search impressions | The number of organic Google Search impressions reported from Search Console. This metric requires an active Search Console link. |
| promotionClicks | Promotion clicks | The number of times an item promotion was clicked. This metric counts the occurrence of the ‘select_promotion’ event. |
| promotionViews | Promotion views | The number of times an item promotion was viewed. This metric counts the occurrence of the ‘view_promotion’ event. |
| publisherAdClicks | Publisher ad clicks | The number of ad_click events. |
| publisherAdImpressions | Publisher ad impressions | The number of ad_impression events. |
| purchaseRevenue | Purchase revenue | The sum of revenue from purchases made in your app or site. Purchase revenue sums the revenue for these events: ‘purchase’, ‘ecommerce_purchase’, ‘in_app_purchase’, ‘app_store_subscription_convert’, and ‘app_store_subscription_renew’. Purchase revenue is specified by the ‘value’ parameter in tagging. |
| purchaseToViewRate | Purchase-to-view rate | The number of users who purchased a product(s) divided by the number of users who viewed the same product(s). This metric is returned as a fraction; for example, 0.128 means 12.8% of users that viewed a product(s) also purchased the same product(s). |
| purchaserConversionRate | Purchaser conversion | The percentage of active users who made 1 or more purchase transactions. This metric is returned as a fraction; for example, 0.412 means 41.2% of users were purchasers. |
| returnOnAdSpend | Return on ad spend | Return On Ad Spend (ROAS) is total revenue divided by advertiser ad cost. |
| screenPageViews | Views | The number of app screens or web pages your users viewed. Repeated views of a single page or screen are counted. (screen_view + page_view events). |
| screenPageViewsPerSession | Views per session | The number of app screens or web pages your users viewed per session. Repeated views of a single page or screen are counted. (screen_view + page_view events) / sessions. |
| screenPageViewsPerUser | Views per user | The number of app screens or web pages your users viewed per active user. Repeated views of a single page or screen are counted. (screen_view + page_view events) / active users. |
| scrolledUsers | Scrolled users | The number of unique users who scrolled down at least 90% of the page. |
| sessionConversionRate | Session conversion rate | The percentage of sessions in which any conversion event was triggered. |
| sessions | Sessions | The number of sessions that began on your site or app (event triggered: session_start). |
| sessionsPerUser | Sessions per user | The average number of sessions per user (Sessions divided by Active Users). |
| shippingAmount | Shipping amount | Shipping amount associated with a transaction. Populated by the ‘shipping’ event parameter. |
| taxAmount | Tax amount | Tax amount associated with a transaction. Populated by the ‘tax’ event parameter. |
| totalAdRevenue | Total ad revenue | The total advertising revenue from both Admob and third-party sources. |
| totalPurchasers | Total purchasers | The number of users that logged purchase events for the time period selected. |
| totalRevenue | Total revenue | The sum of revenue from purchases, subscriptions, and advertising (Purchase revenue plus Subscription revenue plus Ad revenue). |
| totalUsers | Total users | The number of distinct users who have logged at least one event, regardless of whether the site or app was in use when that event was logged. |
| transactions | Transactions | The count of transaction events with purchase revenue. Transaction events are in_app_purchase, ecommerce_purchase, purchase, app_store_subscription_renew, app_store_subscription_convert, and refund. |
| transactionsPerPurchaser | Transactions per purchaser | The average numer of transactions per purchaser. |
| userConversionRate | User conversion rate | The percentage of users who triggered any conversion event. |
| userEngagementDuration | User engagement | The total amount of time (in seconds) your website or app was in the foreground of users’ devices. |
| wauPerMau | WAU / MAU | The rolling percent of 30-day active users who are also 7-day active users. This metric is returned as a fraction; for example, 0.234 means 23.4% of 30-day active users were also 7-day active users. |